

When first starting off with web development, it’s easy to get overwhelmed by the many tools out there. Developer tools are certainly handy, but you only need a couple in your arsenal to be an effective developer. Chrome DevTools is one tool that is absolutely crucial to any web developer. In fact, I would say Chrome DevTools is my #1 tool, it helps me get the job done 99% of the time. So without further ado, let’s dive into what makes Chrome DevTools so useful! And why I recommend it to anyone involved with web development.
What are the Chrome DevTools? How do I access it?
I’m glad you asked! Chrome DevTools is a set of useful web developer tools that can be accessed directly in your chrome browser. One way you can access it is by left clicking on the element you’re interested in viewing, selecting Inspect, and bam! The DevTools will open either appended to the bottom of your window, or you can set it to append to the left or right of the window respectively. Another way to bring it up is Option + ⌘ + J (on macOS), or Shift + CTRL + J (on Windows/Linux).
Let’s start breaking down the parts to the DevTools you have available here bit by bit.
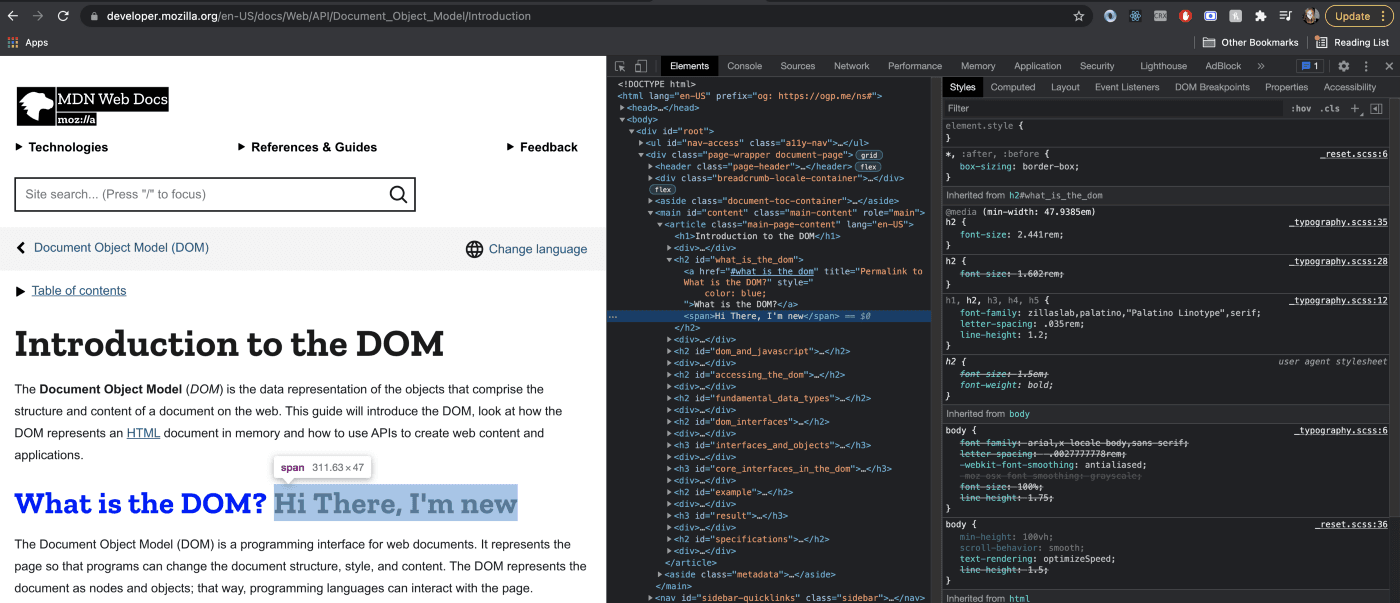
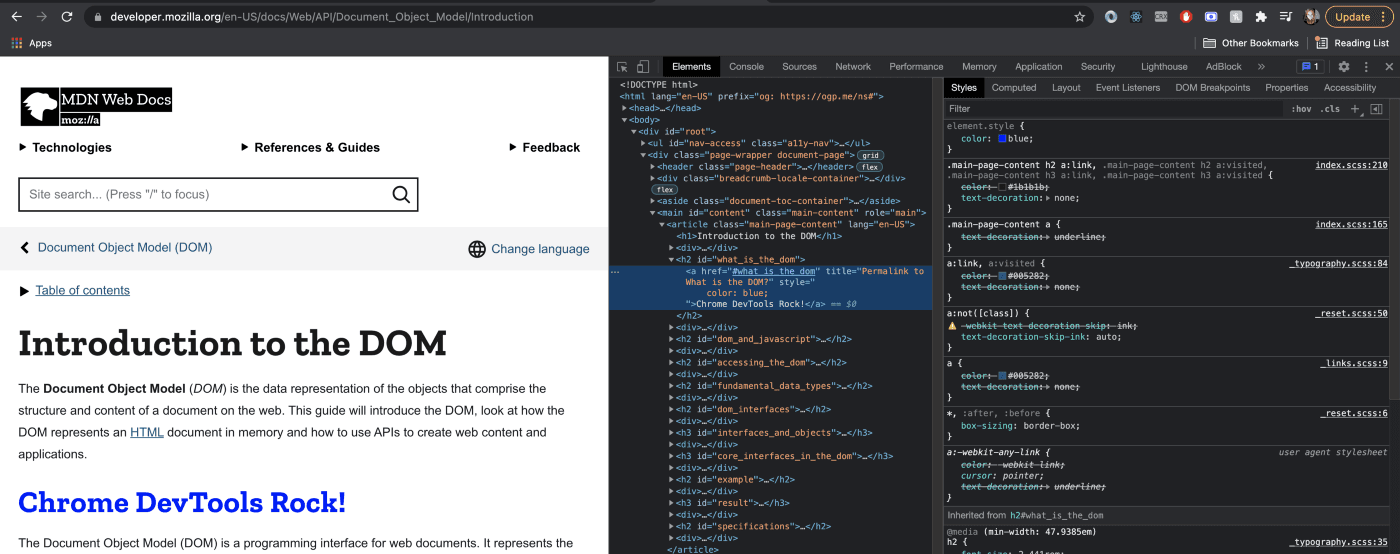
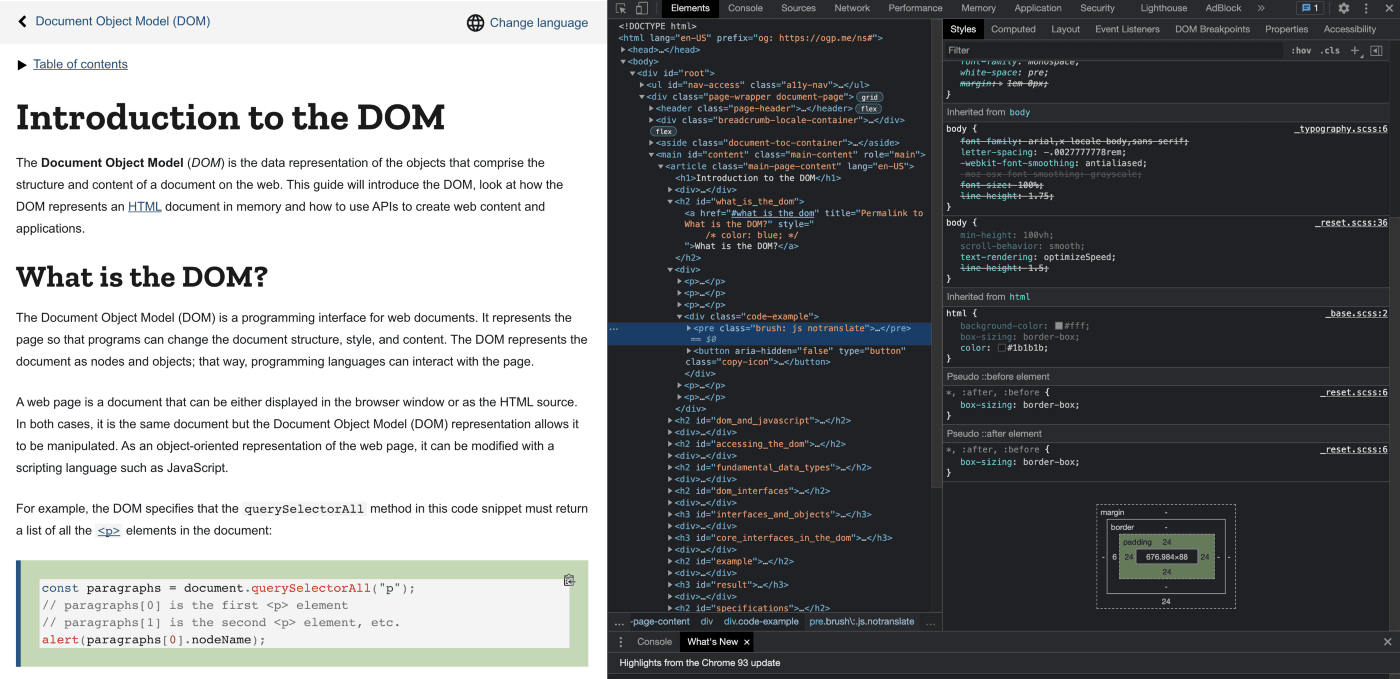
Elements Tab: gives a breakdown of the DOM elements composing your page. As a developer, you may want to see *if* your element is rendering, *where* it is rendering, or maybe you want to mock things out before going back to the code.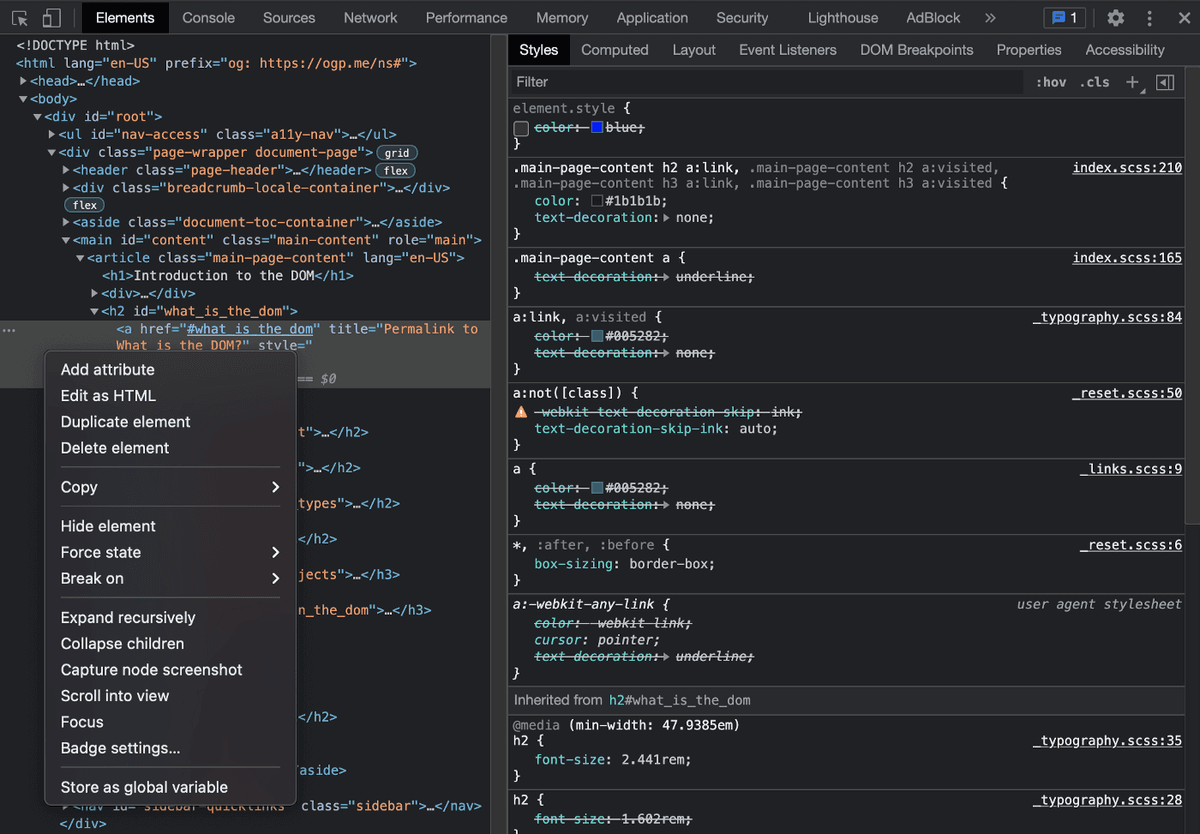
- Insert a new DOM element at a certain level in the tree
- Change some styling to the elements
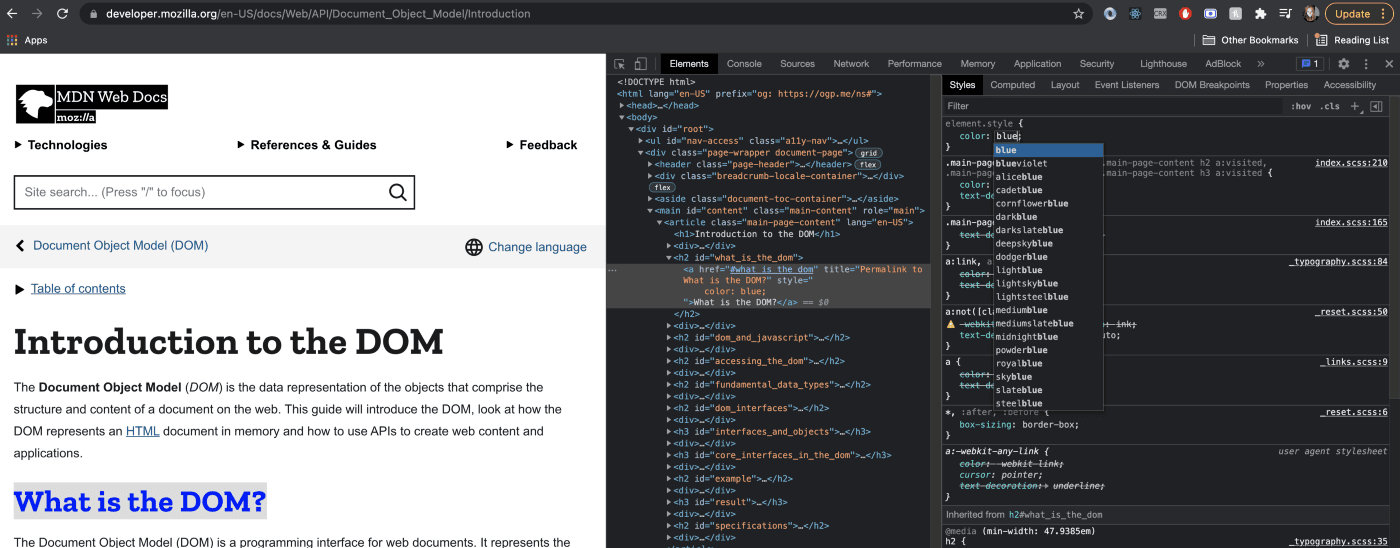
- Add/Change attributes, tag names, or inner text
- Remove DOM nodes entirely from the page by selecting it in the elements tab, and hitting the backspace button
- Do a deeper dive into the Box Model, see how it is set up for the elements. You can examine the margin, border, padding, and content size of the particular element.
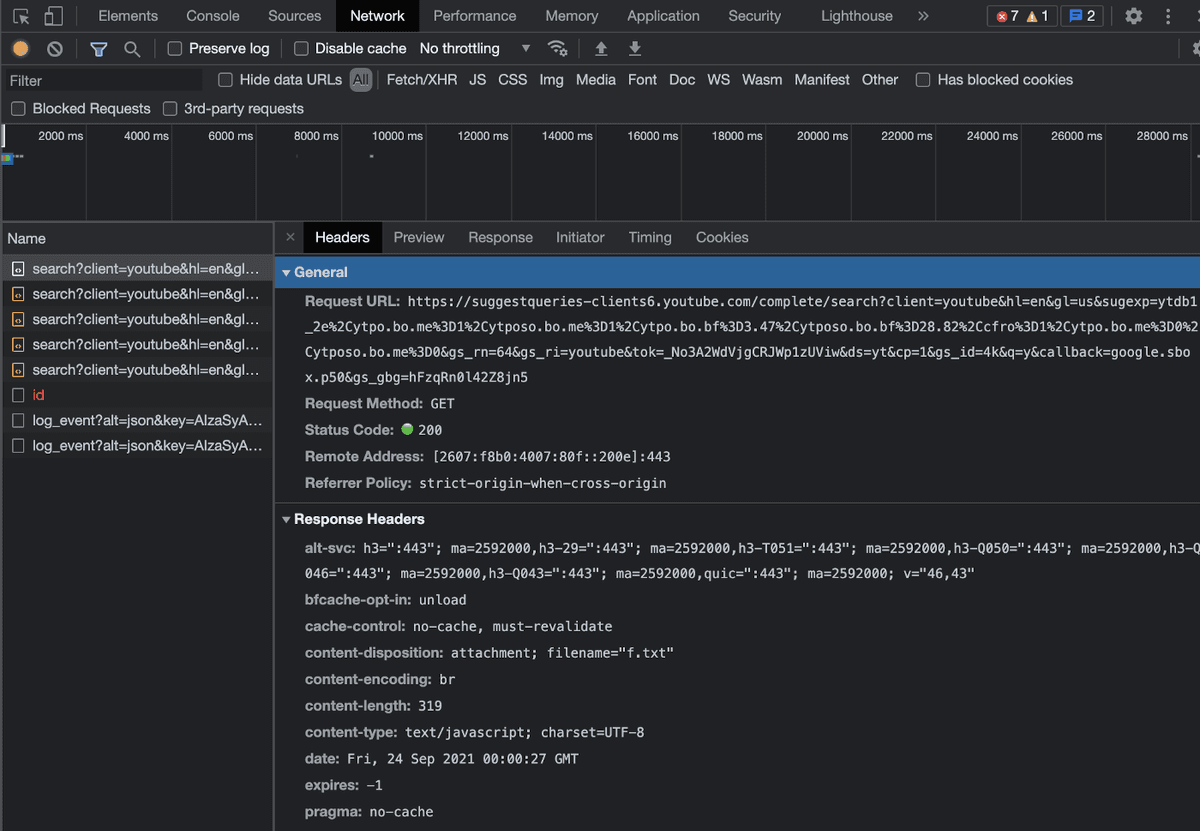
Interesting! We can see a GET request going out. You can see the Request URL, that the Status Code was 200 or successful, and dig even further into the headers. If you click on Response, you can see what the service has come back with, to answer the GET request.
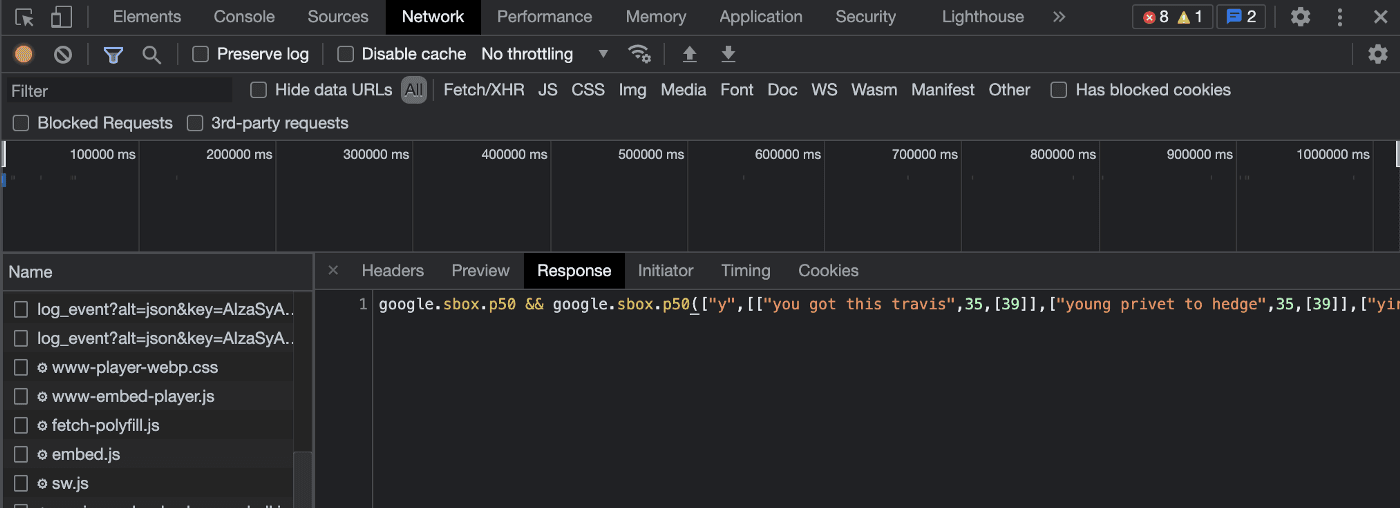
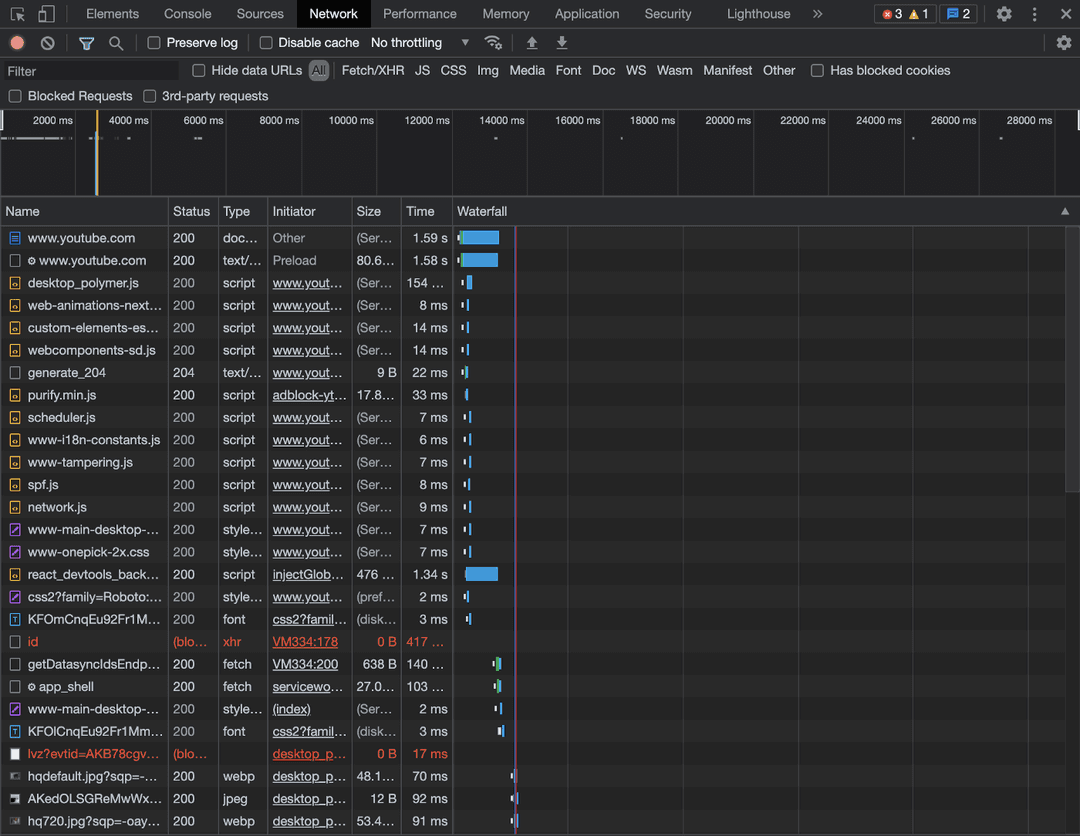
So it seems this is a GET request for suggestions based on what I type! One of the suggestions is “you got this travis”. Yep, Travis definitely does! You’ve got this too! The network tab is quite useful when you have queries that are failing as well. When used the same way, you can track the Status Code, the details of the request you are making, or the response error code from the API to see what the culprit of the problem is. Another key feature in the Network tab is the Waterfall. This gives you a breakdown of the length of time it took for each query to complete, and can help track down particularly slow endpoints or resources that could be making our website less performant.
After stopping the recording, you can see a breakdown of the initial page load.
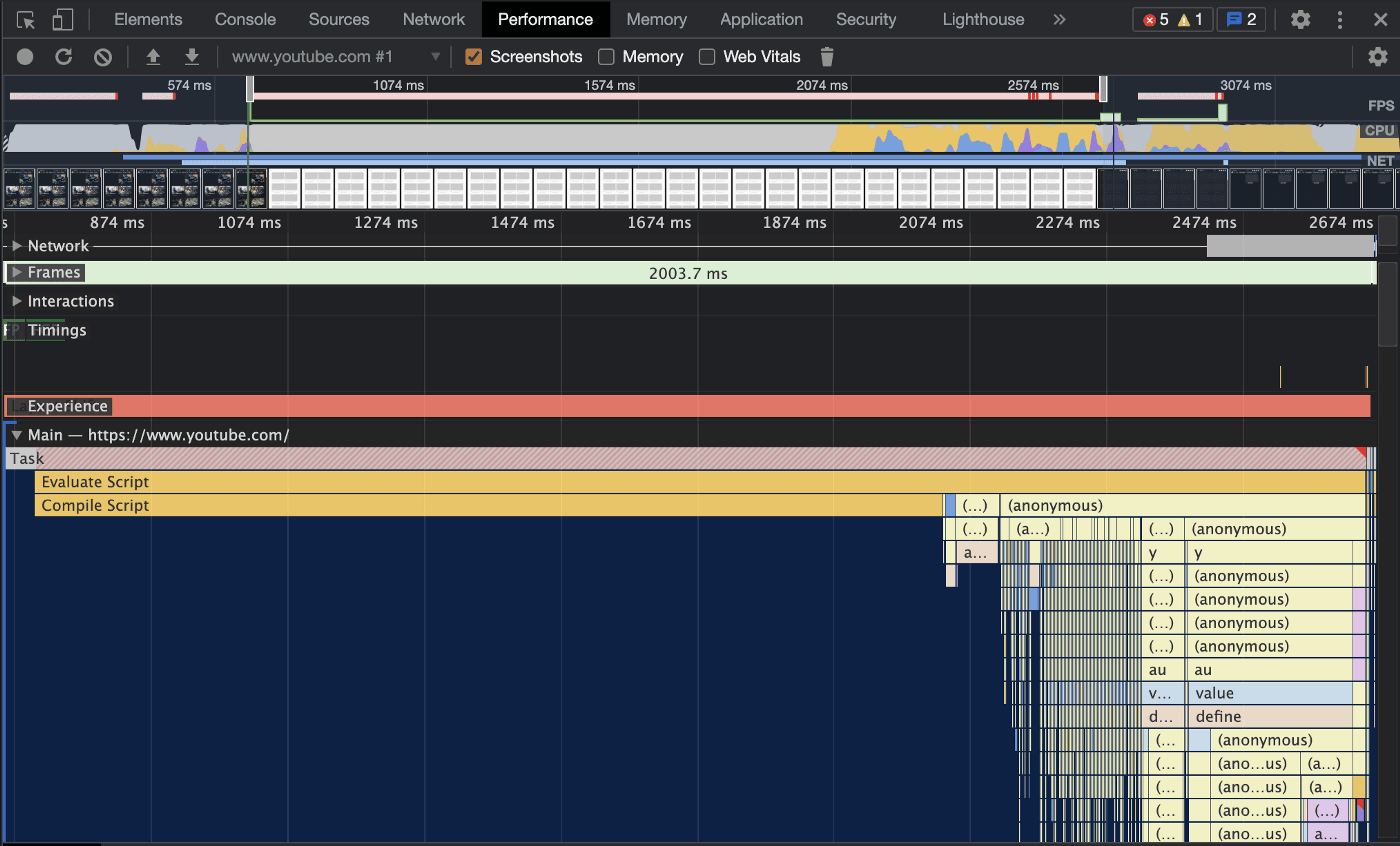
Notice that for 122ms we are presented with the skeletal template of Youtube, as it is fetching the resources necessary to provide us some real content. Not bad!
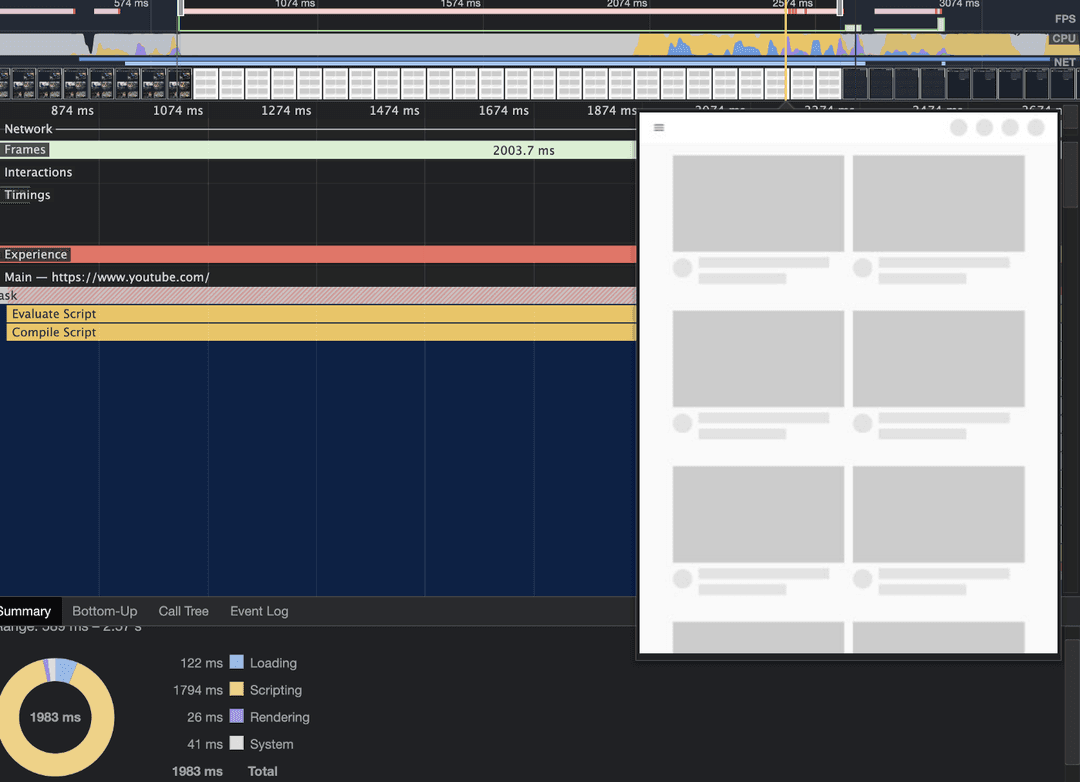
The performance tab allows us to really get into the nitty gritty details of our websites, to make them really shine for our users.
Application tab: The application tab allows us to investigate our service workers if there are any set up, local and session storage details, cookies and more.For Local Storage or Session Storage, we can see the key value pairings the website has setup in our Chrome browser. Please note that session storage has a similar UI! We can edit the values, or delete the pairing if we are testing certain conditions or handlings of our website. I’ll provide an example to provide some clarity on the use case of this section. Let’s say I have a website, where after the user views it three times, I want to present them with an interstitial to subscribe. I also want to keep presenting it until the subscription flow is completed by our user. Instead of loading my website over and over until I reach the required interstitial count, I can just go to Local Storage and edit the value immediately to force the condition.
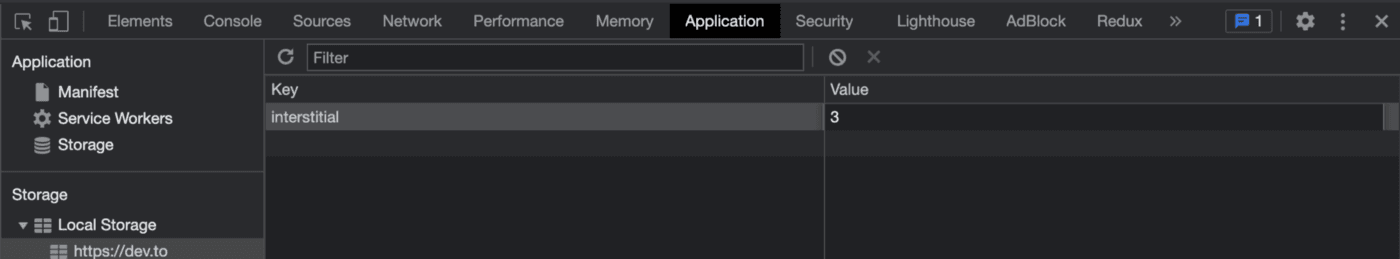
Cool! So the Local Storage section of the Application tab has effectively helped me save some time. The last thing I wanted to cover about the Chrome DevTools, is the capability of testing out our websites responsiveness.

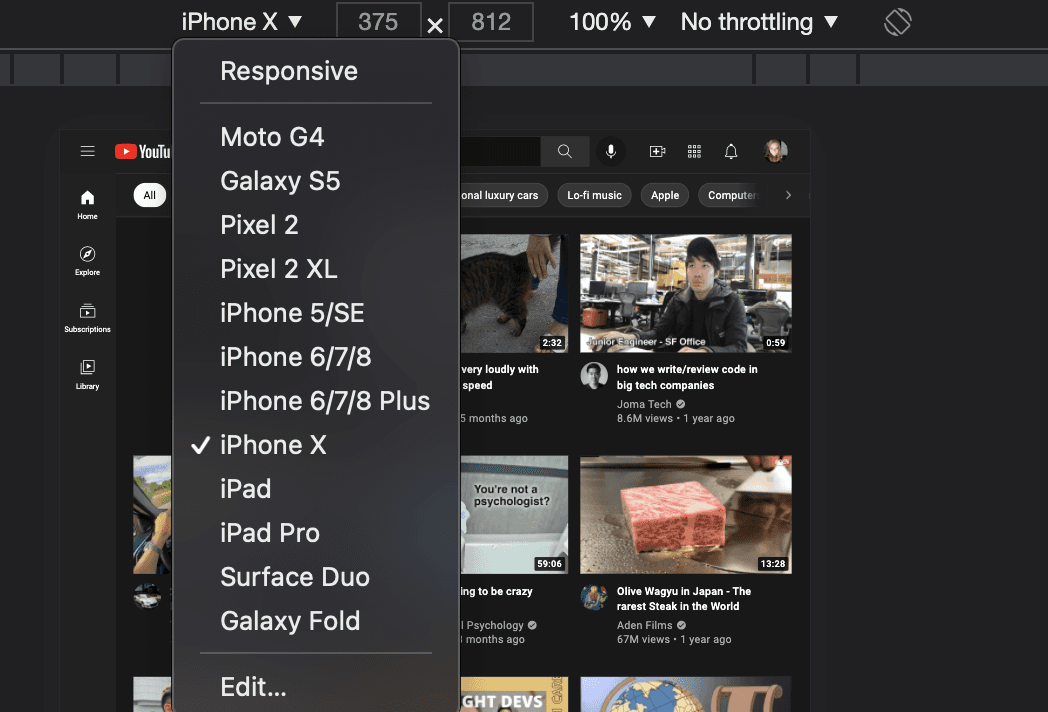
We can see at the top left corner of the tool an icon that shows a small screen overlapping a larger screen. This is a quick access toggle tool, which serves the purpose of switching between a wider desktop view and a mobile web view. If we wanted to scope the view to pixel specific, you should see a new header with preset phone device types. You can even manually input the width and the height in the input fields to match your exact desired conditions if you wanted!
Remember, developers are creatures that turn coffee into code. So I'd very much appreciate if you bought me a coffee!  I’m a new writer and I will be posting very frequently on my findings and learnings in the tech industry and beyond. Join my newsletter if you would like to stay tuned!
Thanks for reading again! ❤️
| Understand Open Graph Dynamic Image Meta Tags | 1 |
| Pros and Cons of Caching Data in Software | 2 |
| How to build a Modal in ReactJS (Part One) | 3 |